The graph summarizes the responses from 4.500 respondents who rated their degree of confidence in each of eight United States institutions. Each respondent gave each institution one of five confidence ratings: high, moderate, little, none, or undecided.
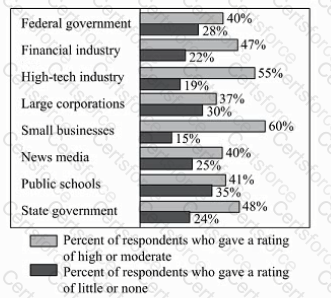
For the respondents who rated their degree of confidence in state government high or moderate, the ratio of the number who gave a rating of high to the number who gave a rating of moderate was 1 to 3. How many of the respondents rated their degree of confidence in state government high?
Submit