Using the Time Series table, create a chart that shows the percent difference in Average Inventory on Hand for each Assortment by year and quarter.
How many quarters did the Electronics Assortment show a negative percent difference in the Average Inventory On Hand?
What is the one most important thing you should do after creating a Dual-axis chart?
Which of the following are compelling reasons to use a Stacked Bar Chart?
Question 30: Skipped
Using the CoffeeChain table, create a scatter plot of Profit (x-axis) vs Sales (y-axis) broken down by State. Add a Linear trend line to the view. What is its R-squared value?
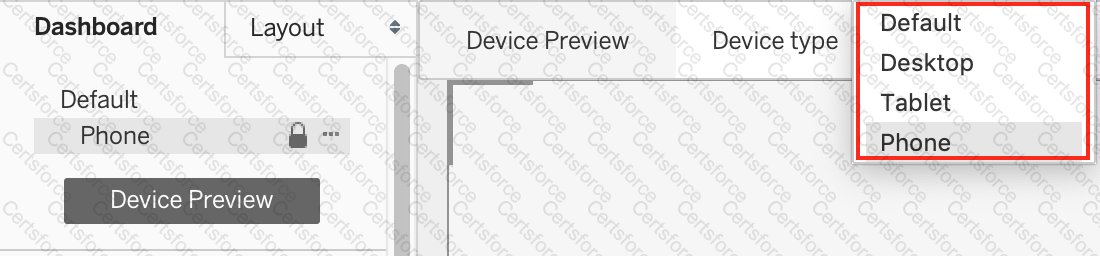
When creating a dashboard for multiple devices, which of the following Device options are available in the Device Preview section?
Which of the following is an example of a Date Part?
Using the Time Series Table, create a Line chart showing the Monthly Year over Year Growth for the Sales, broken down by Assortment. For the Electronics assortment, which Month had the most NEGATIVE value of Year over Year Growth?
How does Tableau know at which level to aggregate values?
Which of the following are valid objects when creating a dashboard in Tableau? Choose 4.
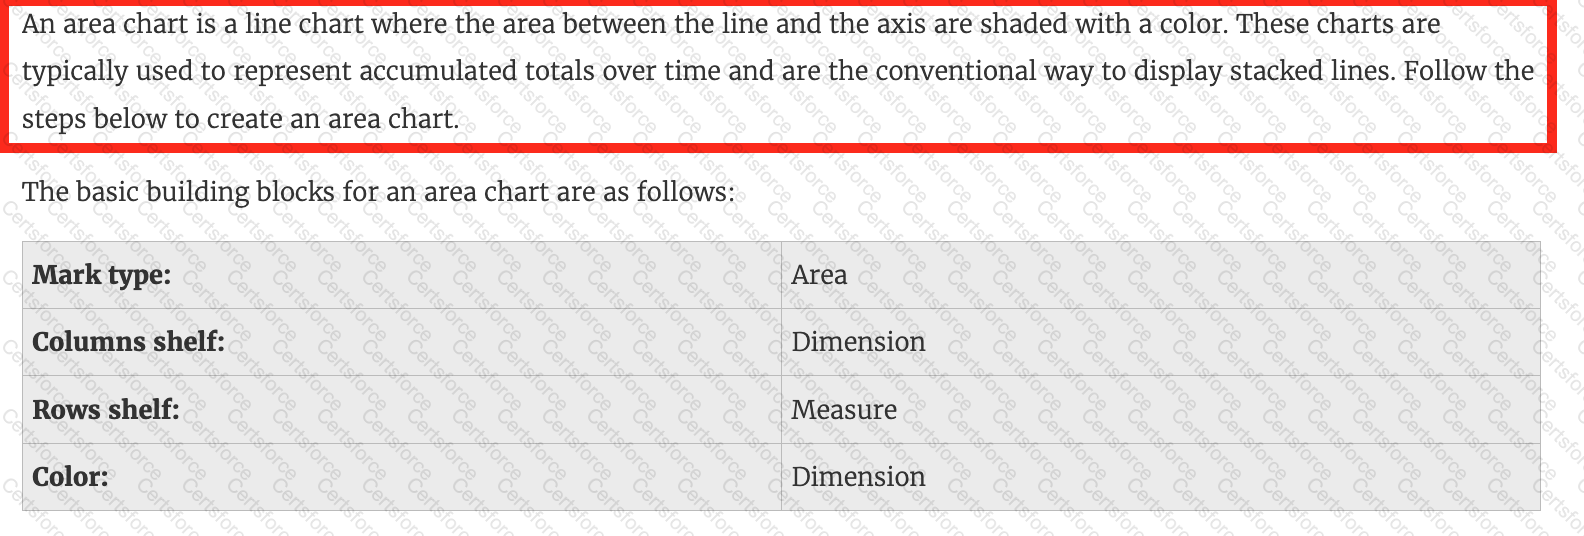
_____________ charts are typically used to represent accumulated totals over time and are the conventional way to display stacked lines.
 Graphical user interface
Description automatically generated
Graphical user interface
Description automatically generated