The VP of Finance is requesting a presentable solution that allows them to share finance information in monthly meetings with C-suite executives. Given the monthly meeting agendas, the solution must be customizable.
Which Qlik Sense feature should be implemented to meet this requirement?
A project management team uses an app to monitor different projects.
• Projects may have co-dependent tasks and processes
• Some projects include subtasks
The business analyst needs to use a diagram similar to a workflow with the processes and the sub tasks represented as boxes with lines to relate them to each other. The color of the boxes could also be determined by the status of each project or task.
Which visualization should be used?
A clothing manufacturer has operations throughout Europe and needs to manage access to the data.
There is data for the following countries under the field SACOUNTRY -> France, Spain, United Kingdom and Germany. The application has been designed with Section Access to manage the data displayed.
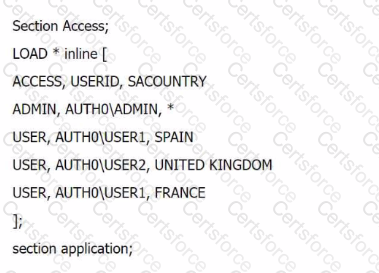
What is the expected outcome of this Section Access table?
Refer to the exhibit.
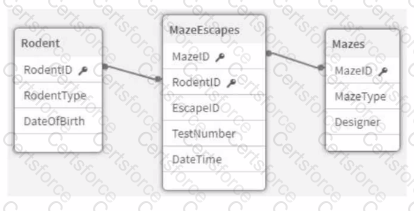
An app that will track experiments for rodents (e.g., rats and mice) that navigate mazes (labyrinths) is being developed. Individual rodents are catalogued in the Rodent table, while the Mazes table has metadata for the mazes. The MazeEscapes table holds a record of each attempt at a maze by a rodent. A business analyst needs to build a KPI that will allow users to see how many rodents have made at least one attempt at any maze.
How should the analyst construct the KPI?
A business analyst is creating an app for the sales team. The app must meet several requirements:
• Compare 10 top-performing sales representatives and the amount of sales for each
• Investigate margin percentage and total sales by each product category
• View distribution of sales amount
Which visualizations should be used for this app?
The CEO has requested a dashboard that tracks the company's performance. The main requirements for the dashboard:
• Minimal number of visualizations or objects
• Display multiple key measures
• Ability to easily navigate to other sheets
Which features would meet the requirements?
A banking organization needs a dashboard that shows the following:
• A KPI indicator for current year (CY) versus last year (LY) revenue
• A scatter plot that shows the cost versus revenue of product categories
• A treemap that shows average customer satisfaction rating based on regions
• A table that shows CY cost by record number, financial instrument, and bank
In addition to the customer satisfaction rating, which fields should be used to create the required measures?
A business analyst is developing an app that contains a data model with fields: Country, City, Sales, ProductName, and ProductCategory. The global sales manager wants to add new visualizations to this app.
The business analyst must include the following:
• Ability to dynamically change the number of countries and cities
• Display a maximum of 10 countries
• Display a maximum of 5 cities per country
Which steps should the business analyst take?
A customer needs to demonstrate the value of sales for each month of the year with a rolling 3-month summary. Which visualization should the business analyst recommend to meet the customer's needs?
A business analyst is working with a customer to refine the end user experience. The customer has the following requirements:
• Ability to provide these charts to a specific user group
• Minimize the number of navigation clicks between charts
• Achieve fastest screen response time when switching between charts
• Maximize the chart size in terms of screen real estate
Which action should the business analyst take to meet the requirements?