Refer to the exhibit.
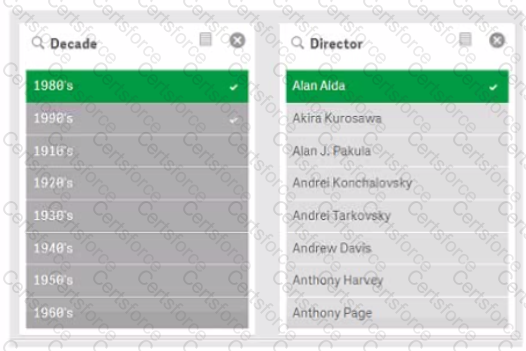
What is the selection slate of light gray values?
A business analyst is creating a new app with sales data.The visualizations must meet several requirements:
• A Bar chart mat shows sales by product group is used m multiple sheets
• A KPI object that visualizes that the total amount of sales is used once
• A Treemap mat shows margin by product group is used one time inside a Container
What should be added to the master items library?
A business analyst needs to create a master item from an object m an app After right-clicking the object the analyst notices the Add to master Items option is NOT available.What should the business analyst do to fixthis issue?
A business analyst is creating an app that requires several visualizations
• A scatter plot mat shows the margin percentage and total sales by product category
• A map with a the layer that visualizes lines between retail stores and lactones
• A KPI that shows total cost
Margin% can be calculated by dividing profit by revenue Profit is the difference between total cost and total sates
Which two sets of fields can the business analyst use to meet these requirements? (Select two.)
A business analyst is designing a business intelligence solution to track production.There are several requirements in the complicated factory environment
• Printed work summary documents produced daily
• Information monitors that show custom website with visualizations from QIA Sense
• Ability to calculate the shortest routes between two sets of coordinates
Which three options are needed to meet these requirements? (Select three)
A business analyst needs to uniquely identify tour sheets in the app overview Custom images have been created for each sheet What should the business analyst do next?
The sales manager is investigating the relationship between Sales and Margin to determine if this relationship is linear when choosing the dimension Customer or Product Category
The sales manager wants to have the potential percentage Sales tor each Stage (initial to Won) of the sales process
What are the two correct visualizations?
A Help Desk department sets a first-time fix target of 65% for ail customer calls. The department has a measure that captures the actual first-time fix percentage. A business analyst needs to choose the visualization that most effectively shows the performance against the target using a color gradient Which visualization should the business analyst use?
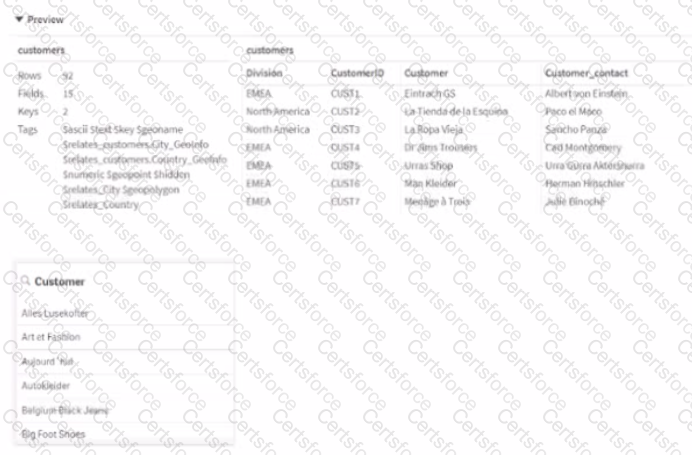
Refer to the exhibits.
These tables have the same structure. The Customers information is as shown in the Data Model Viewer In a sheet called "Customer Analysis" there is a filter pane with Customers.
A business analyst s developing an app for the Sales department and loads the data about Customers from two files.
The business analyst wants the values to appear as they were loaded How should this issue be resolved?
Several departments use an app. The business analyst needs to modify access to the sheets so that each department can access their sheets only What should me business analyst do?