You have a CSV file that contains user complaints. The file contains a column named Logged. Logged contains the date and time each complaint occurred. The data in Logged is in the following format: 2018-12-31 at 08:59.
You need to be able to analyze the complaints by the logged date and use a built-in date hierarchy.
What should you do?
You are using the key influencers visual to identify which factors affect the quantity of items sold in an order.
You add the following fields to the Explain By field:
* Customer Country
* Product Category
* Supplier Country
* Sales Employee
* Supplier Name
* Product Name
* Customer City
The key influencers visual returns the results shown in the following exhibit.
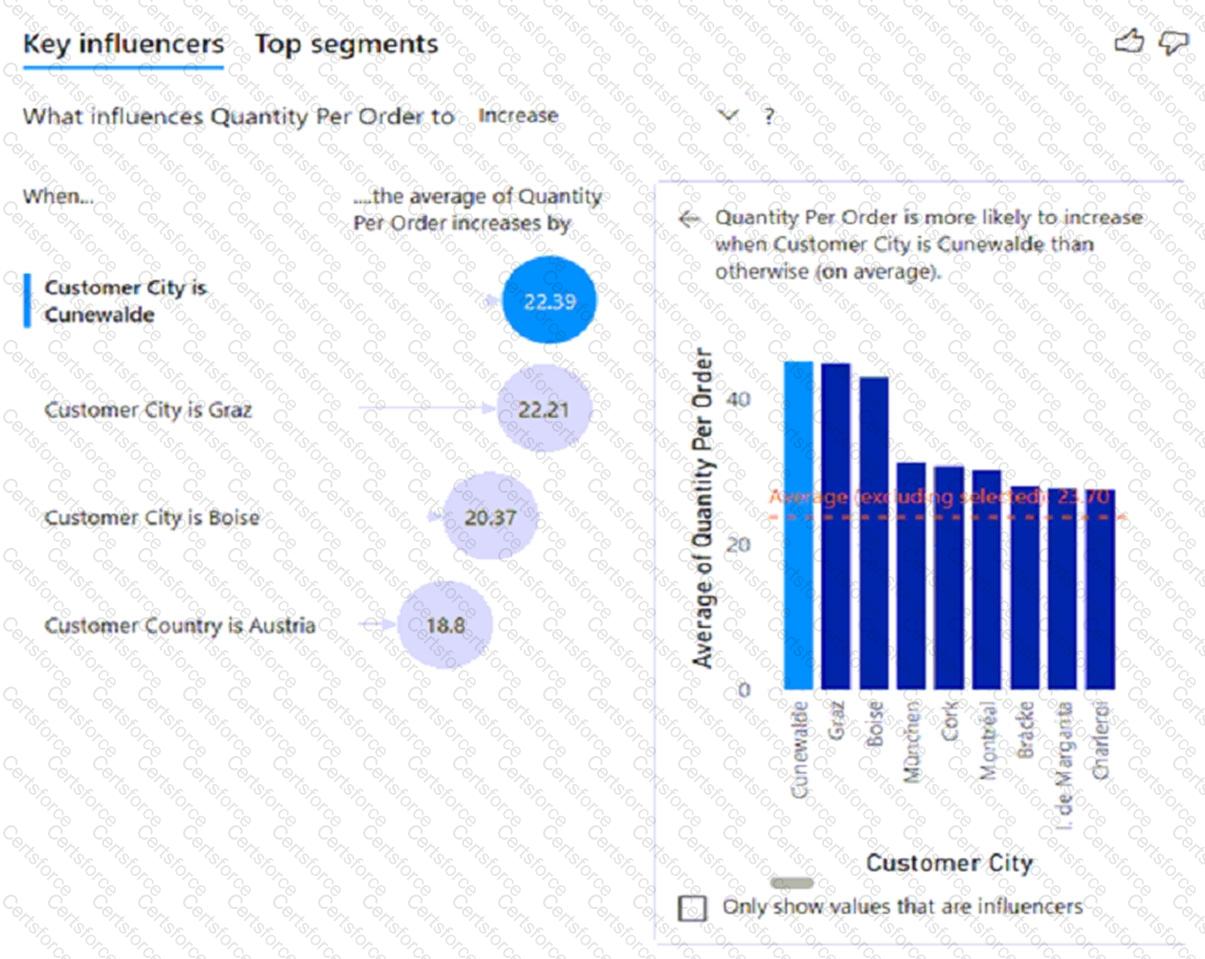
What can you identify from the visual?
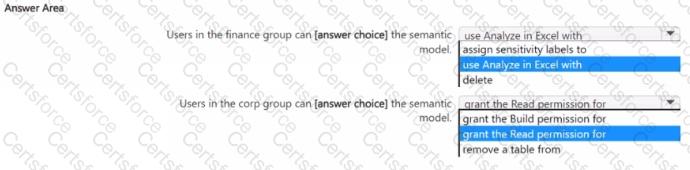
You have a semantic model that has the permissions shown in the following exhibit.
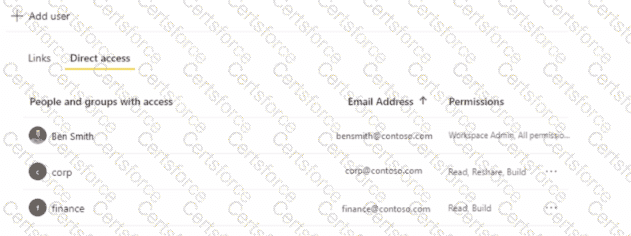
Use the drop-down menus to select the answer choice the that completes each statement based on the information presented in the graphic.
NOTE: Each correct selection is worth one point.
You maintain a Power Bl workspace that contains a supplier quality dashboard. The dashboard contains 10 card visuals, two map visuals and five bar chart visuals.
The dashboard mobile layout is shown in the exhibit. (Click the Exhibit tab.)

You need to modify the dashboard mobile layout to meet the following requirements:
• Only show single-value visuals.
• Minimize scrolling.
What should you do?
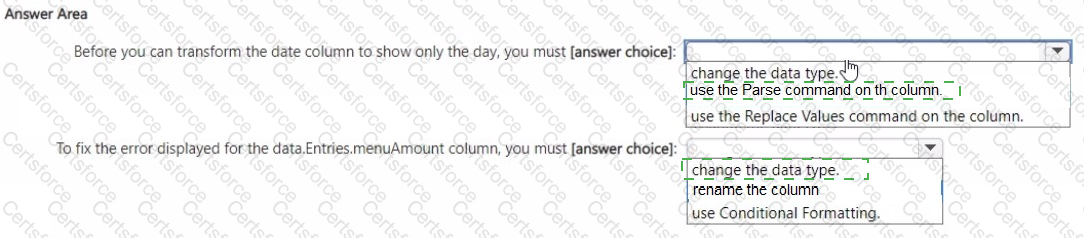
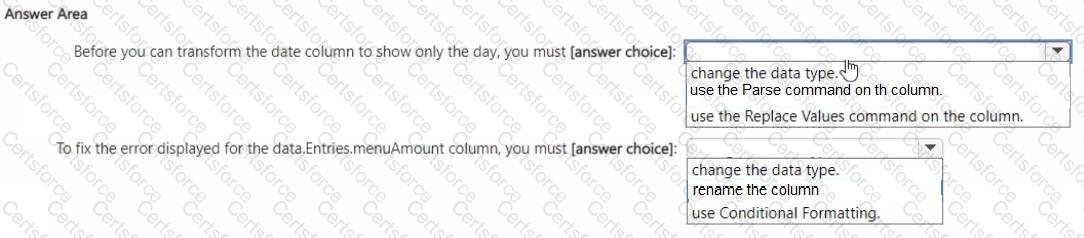
You are using Microsoft Power Bl Desktop to profile data in Power Query Editor. Table data is displayed as shown in the following exhibit.
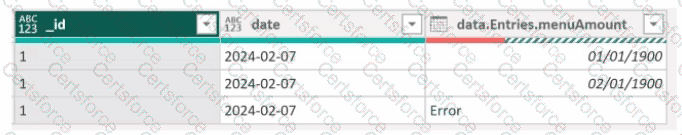
Use the drop-down menus to select the answer choice that completes each statement based on the information presented in the graphic.
NOTE: Each correct selection is worth one point.
You have a report that contains a donut chart and a clustered column chart. Interactions between the visuals use the default settings.
You need to modify the report so that when you select a column m the column chart, the donut chart redraws by using the data from the selected column.
What should you do?
Note: This question is part of a series of questions that present the same scenario. Each question in the series contains a unique solution that might meet the stated goals. Some question sets might have more than one correct solution, while others might not have a correct solution.
After you answer a question in this section, you will NOT be able to return to it. As a result, these questions will not appear in the review screen.
You create a parameter named DataSourceExcel that holds the file name and location of a Microsoft Excel data source.
You need to update the query to reference the parameter instead of multiple hard-coded copies of the location within each query definition.
Solution: You add a Power Apps custom visual to the report.
Does this meet the goal?
In Power BI Desktop, you are creating a report that will contain three pages.
You need to create a custom tooltip page and prepare the page for use.
Which three actions should you perform? Each correct answer presents part of the solution.
Note: This question is part of a series of questions that present the same scenario. Each question in the series contains a unique solution that might meet the stated goals. Some question sets might have more than one correct solution, while others might not have a correct solution.
After you answer a question in this section, you will NOT be able to return to it. As a result, these questions will not appear in the review screen.
From Power Query Editor, you profile the data shown in the following exhibit.
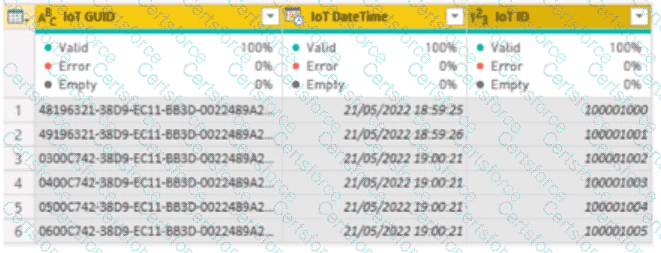
The IOT ID columns are unique to each row in query.
You need to analyze 10T events by the hour and day of the year. The solution must improve dataset performance.
Solution: You change the IOT DateTime column to the Date data type.
Does this meet the goal?
You have a Power BI model that contains the following data.
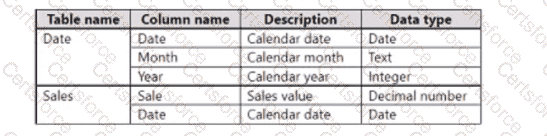
The Date table relates to the Sales table by using the Date columns.
You need to create a calculated table that v/ill contain the following: