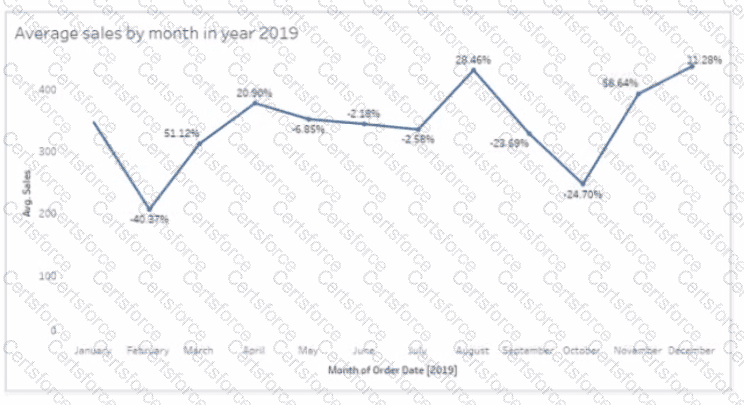
Based on the line chart provided, each point on the line chart represents the average sales for a given month, and the percentage values indicate the change in average sales compared to the previous month. The month of November shows a significant increase from the month of October, indicated by a large upward spike on the chart and a high percentage increase.
Contribute your Thoughts:
Chosen Answer:
This is a voting comment (?). You can switch to a simple comment. It is better to Upvote an existing comment if you don't have anything to add.
Submit