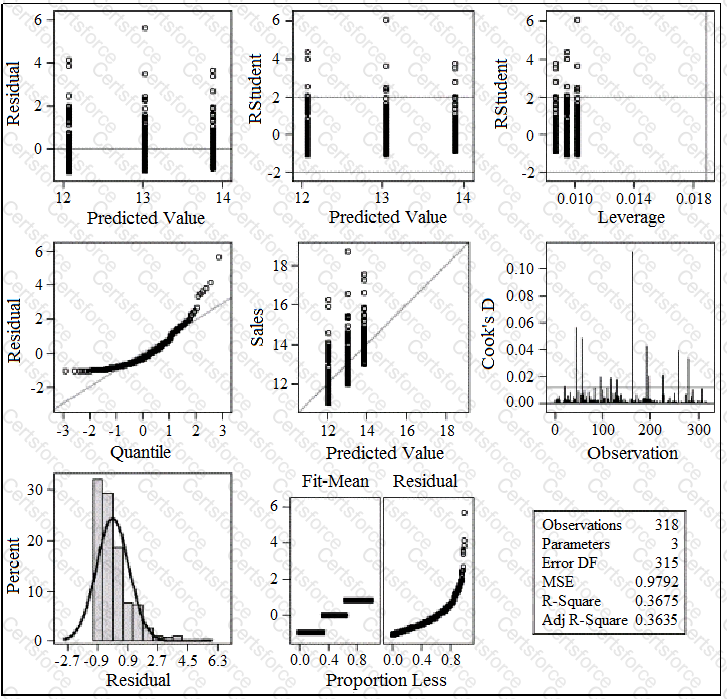
Refer to the exhibit.
These graphs were created using the GLM procedure with the plots(only)=diagnostics option.
Which plot do you use to identify influential observations?
Cook's D by Observation
Residual by Quantile
Residual by Predicted
Fit - Mean and Residual Plot
Submit