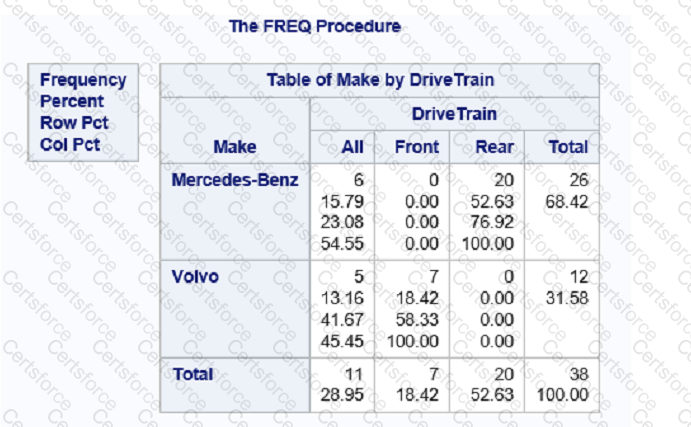
The report shown in the image is a two-way frequency table generated by the PROC FREQ procedure which shows the frequency and percentage distribution of two categorical variables. The correct answer is option B:
proc freq data=cars; tells SAS to use the PROC FREQ procedure on the dataset cars.
tables make*drivetrain; requests the frequency table for the cross of make and drivetrain. The asterisk (*) denotes a two-way table of the two categorical variables.
run; indicates the end of the proc freq step.
The resulting table in the output has the statistics for Make broken down by Drivetrain category, which matches the structure seen in the provided image.
Options A, C, and D do not correctly request the two-way table of make by drivetrain. Specifically, C and D reverse the order, which would change the orientation of the table in the output, and A is missing the asterisk (*) which is needed for the cross-tabulation of the two variables.
References:
SAS 9.4 documentation for the PROC FREQ statement: SAS Help Center: PROC FREQ
Contribute your Thoughts:
Chosen Answer:
This is a voting comment (?). You can switch to a simple comment. It is better to Upvote an existing comment if you don't have anything to add.
Submit