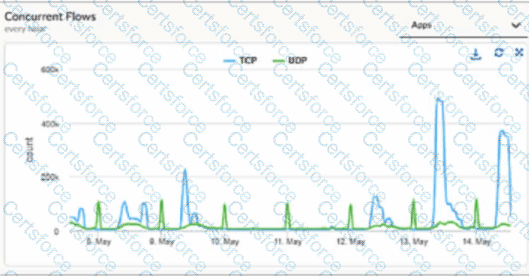
When a Prisma SD-WAN ION device triggers the DEVICESW_CONCURRENT_FLOWLIMIT_EXCEEDED incident, it indicates that the number of active sessions has reached the hardware or software-defined capacity limit of that specific appliance. In the provided graph, we can see a massive spike in concurrent TCP flows on May 13th, reaching nearly 500k, which is a clear indicator of anomalous behavior—likely a "top talker" host, a malware outbreak, or a misconfigured application generating excessive connections.
To identify the specific host responsible for this surge, administrators should navigate to Monitor → Activity → Flows. This interface, commonly known as the Flow Browser, provides the most granular visibility into real-time and historical session data within the Prisma SD-WAN fabric. Unlike "Transaction Stats," which provide high-level summaries, or "New Flows," which only show the rate of session initiation, the Flows view allows an engineer to filter and sort the active session table by metadata such as Source IP, Destination IP, Application, and Site.
By utilizing the Flow Browser, an administrator can quickly group flows by "Source IP" to pinpoint exactly which internal host is consuming the most flow table entries. This is the standard "Day 2" operational workflow for troubleshooting performance and capacity incidents. While running a tcpdump (Option A) is a valid diagnostic for packet-level analysis, it is inefficient for identifying a single host among hundreds of thousands of flows and can further tax the device's CPU during a high-load event. The Monitor → Activity → Flows tool is designed specifically for this type of scale, providing the necessary visibility to remediate the flow limit exhaustion and restore normal network operations.
Submit