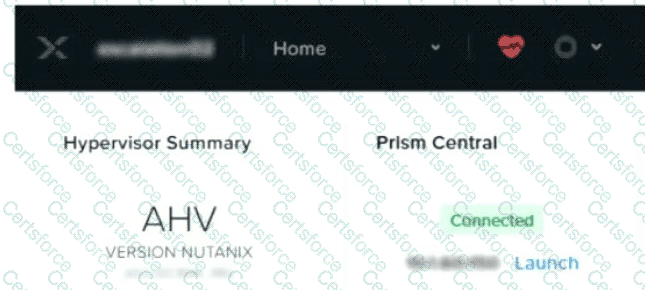
In Nutanix Prism Element, thered heart iconat the top-right of the UI indicates that there is acritical alertaffecting the cluster's health. This icon is part of theAlert Monitoring System, and clicking on it redirects the user to theAlerts dashboard, where all current active alerts—including their severity, source, and recommended remediation steps—are listed.
What to do:
Navigate to theAlertssection.
Review allcritical alertsfor further diagnosis.
Cross-reference with theHealth dashboardif deeper system component checks are needed.
Clarification of Other Options:
A. Health:Summarizes system component states but does not provide detailed alert causes.
B. Tasks:Tracks user-initiated jobs, unrelated to fault diagnosis.
D. Analysis:Used for performance metrics and trends, not fault alerts.
Prism UI Navigation Path:
Click the red heart icon → Alerts Dashboard
Official Reference:
Nutanix Administration Guide – Alerts and Monitoring
Excerpt: “A red heart icon in Prism indicates a critical alert. Use the Alerts dashboard to identify and resolve the issue.”
Contribute your Thoughts:
Chosen Answer:
This is a voting comment (?). You can switch to a simple comment. It is better to Upvote an existing comment if you don't have anything to add.
Submit