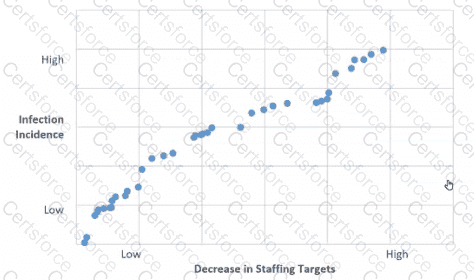
The scatter diagramshows that as the decrease in staffing targets becomes more significant (moving right on the horizontal axis), the incidence of infection goes up (moving up on the vertical axis). This indicates a negative relationship because as one variable increases, the other one decreases. The relationship appears to be strong because the points lie closely to an imaginary line that slopes upwards from left to right, which suggests a consistent trend across the data points.
[References:In healthcare quality improvement, it is critical to use data to inform decision-making. Scatter diagrams are a common tool used for this purpose. The NAHQ Healthcare Quality Competency Framework emphasizes the importance of analyzing and utilizing data in decision-making, as indicated in the Performance and Process Improvement domain. A strong negative relationship in this context could indicate that decreased staffing levels are associated with higher infection rates, which is a significant finding for a nursing director assessing outcomes and considering quality improvement initiatives., , , , , , , , ]
Submit