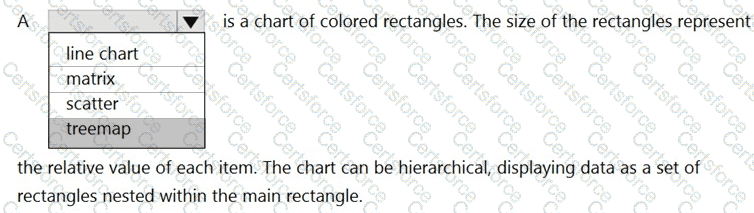
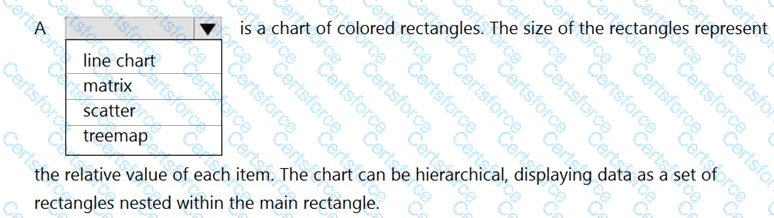
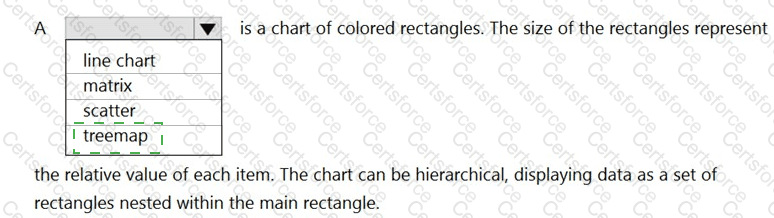
A treemap chart divides the chart area into rectangles that represent the different levels and relative sizes of the data hierarchy.
[Reference:, https://docs.microsoft.com/en-us/sql/reporting-services/report-design/tree-map-and-sunburst-charts-in-reporting-services?view=sql-server-ver15, , ]


Submit