Winter Sale Special Limited Time 70% Discount Offer - Ends in 0d 00h 00m 00s - Coupon code: force70

Microsoft Azure Data Fundamentals DP-900 Question # 34 Topic 4 Discussion

Microsoft Azure Data Fundamentals DP-900 Question # 34 Topic 4 Discussion

DP-900 Exam Topic 4 Question 34 Discussion:
Question #: 34
Topic #: 4

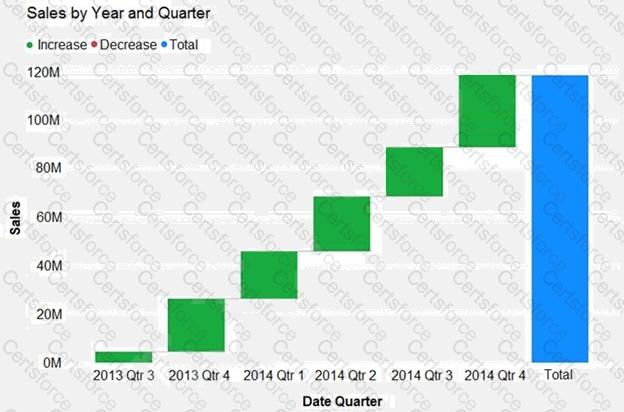
You need to create a visualization of running sales totals per quarter as shown in the following exhibit.

DP-900 Question 34

What should you create in Power BI Desktop?


A.

a waterfall chart


B.

a ribbon chart


C.

a bar chart


D.

a decomposition tree


Get Premium DP-900 Questions

Contribute your Thoughts:


Chosen Answer:
This is a voting comment (?). It is better to Upvote an existing comment if you don't have anything to add.