
According to the Microsoft Azure AI Fundamentals (AI-900) Official Study Guide and the Microsoft Learn module “Explore fundamental principles of machine learning,” regression is a type of supervised machine learning used to predict continuous numeric values.
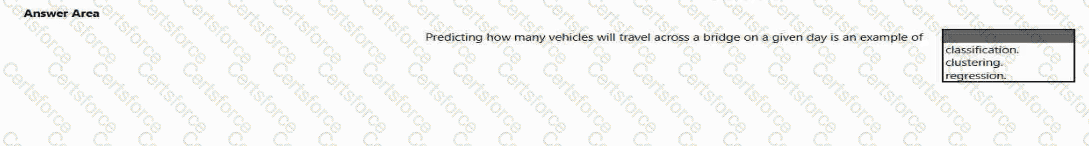
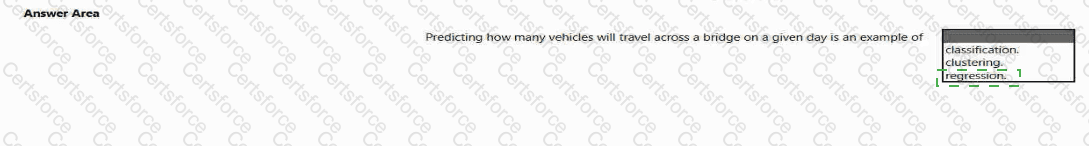
In this question, the goal is to predict how many vehicles will travel across a bridge on a given day. The predicted output (the number of vehicles) is a continuous value—meaning it can take on any numerical value depending on various factors like time, weather, or day of the week. This makes it a regression problem, as the model learns from historical numeric data to estimate a continuous outcome.
How Regression Works:
Regression models find patterns between input features (such as temperature, weekday/weekend, traffic trends) and a numerical output (number of vehicles). Common regression algorithms include linear regression, decision trees for regression, and neural network regression. In Azure Machine Learning, regression tasks are used for business scenarios such as:
Predicting sales revenue for a future month.
Estimating house prices based on property characteristics.
Forecasting energy consumption or traffic flow, as in this case.
Why not the other options?
Classification: Used for predicting discrete categories (e.g., “spam” vs. “not spam”). It does not handle continuous numeric values.
Clustering: An unsupervised learning technique used to group data points based on similarity without predefined labels (e.g., segmenting customers into groups).
Therefore, the task of predicting the number of vehicles—a numeric, continuous value—is a regression problem.
Submit