Context
You have been tasked with scaling an existing deployment for availability, and creating a service to expose the deployment within your infrastructure.
Task
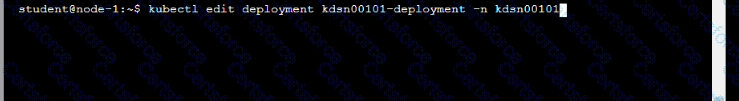
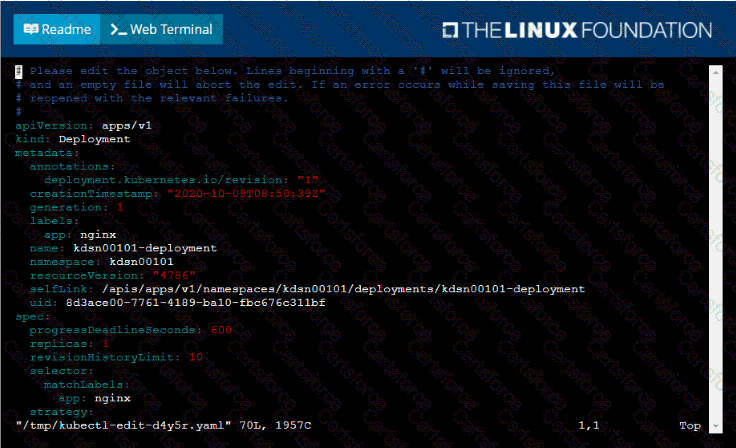
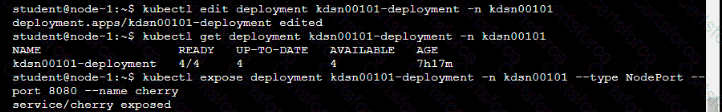
Start with the deployment named kdsn00101-deployment which has already been deployed to the namespace kdsn00101 . Edit it to:
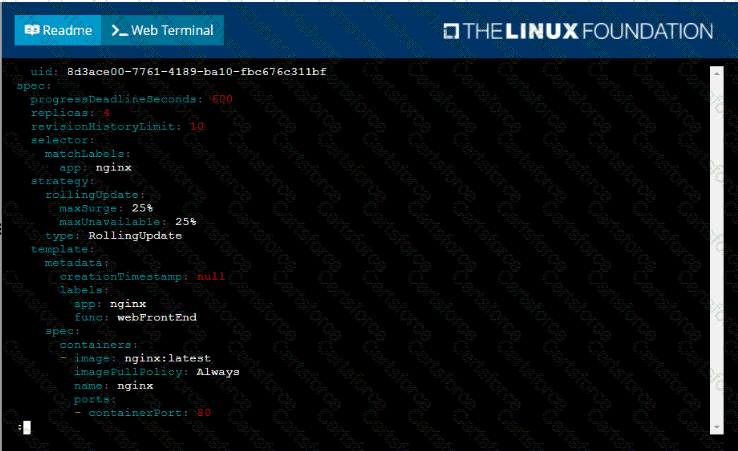
• Add the func=webFrontEnd key/value label to the pod template metadata to identify the pod for the service definition
• Have 4 replicas
Next, create ana deploy in namespace kdsn00l01 a service that accomplishes the following:
• Exposes the service on TCP port 8080
• is mapped to me pods defined by the specification of kdsn00l01-deployment
• Is of type NodePort
• Has a name of cherry
Submit