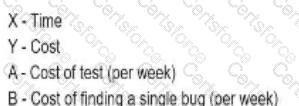
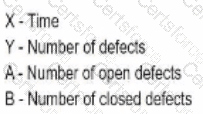
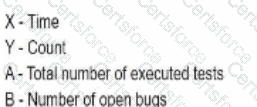
The following chart represents metrics related to testing of a project that was competed. Indicate what is represented by tie lines A, B and the axes X.Y
Chosen Answer:
This is a voting comment (?). You can switch to a simple comment. It is better to Upvote an existing comment if you don't have anything to add.
Submit