GAQM Certified Lean Six Sigma Black Belt (CLSSBB) CLSSBB Question # 97 Topic 10 Discussion
CLSSBB Exam Topic 10 Question 97 Discussion:
Question #: 97
Topic #: 10
A set of data from a process has 8 readings per sample and 50 samples. The mean of the 50 sample means is 12.62. The mean of the 50 ranges is 0.18.Find control limits for the R chart.
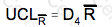
The formula required to calculate control limits for the R chart are as follows:
= 1.864 x 0.18 = 0.33
= 0.1111 x 0.18 = 0.02
Contribute your Thoughts:
Chosen Answer:
This is a voting comment (?). You can switch to a simple comment. It is better to Upvote an existing comment if you don't have anything to add.
 = 1.864 x 0.18 = 0.33
 = 0.1111 x 0.18 = 0.02
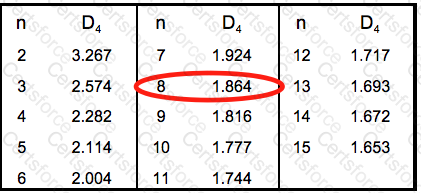
Submit