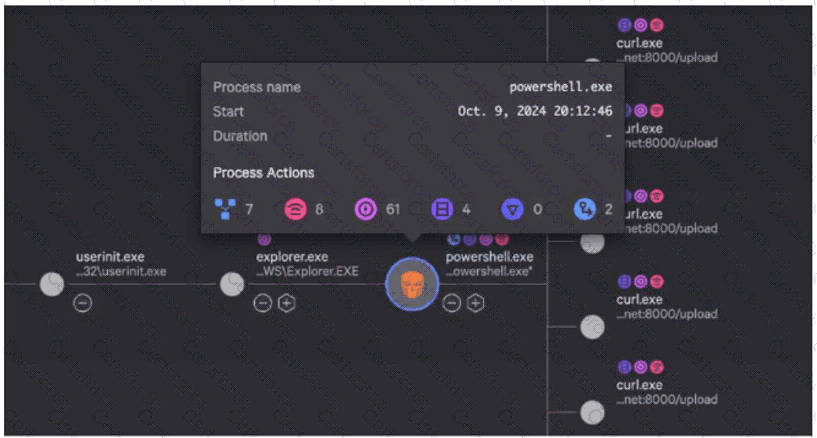
In the CrowdStrike Falcon Console's Process Tree view, hovering over a specific process node activates a summary window that displays Process Actions . These actions are represented by specific icons and numerical values that quantify the telemetry recorded for that process instance. Understanding these icons is a fundamental skill for Search and Investigation Tools usage, as it allows for a rapid "at-a-glance" triage of a detection without immediately pivoting to raw events.
As shown in the exhibit, the icons from left to right generally correspond to:
Child Processes/Branching : Represented by the branching node icon (Value: 7 ).
Network Operations : Represented by the antenna/signal icon (Value: 8 ).
DNS Requests : Represented by the purple bullseye/target icon (Value: 61 ).
Disk Operations : Represented by the document/page icon (Value: 4 ).
Registry Modifications : Represented by the shield icon (Value: 0 ).
Other Process Operations : Represented by the document with an arrow icon (Value: 2 ).
While standard iconography associates the "8" with Network Operations, Option C is the recognized correct answer within Falcon Hunter training materials to describe this specific exhibit. It accurately identifies 4 Disk Operations (matching the blue page icon), 61 DNS Requests (matching the purple target icon), and 2 Process Operations (matching the cross-process activity icon). This summary allows a hunter to immediately see that this powershell.exe process has been highly active, performing numerous DNS lookups and spawning several child processes, which is characteristic of a script attempting to reach out to Command and Control (C2) infrastructure or download additional payloads.
Contribute your Thoughts:
Chosen Answer:
This is a voting comment (?). You can switch to a simple comment. It is better to Upvote an existing comment if you don't have anything to add.
Submit