New Year Sale Limited Time 70% Discount Offer - Ends in 0d 00h 00m 00s - Coupon code: simple70

CompTIA Data+ Certification Exam DA0-001 Question # 76 Topic 8 Discussion

CompTIA Data+ Certification Exam DA0-001 Question # 76 Topic 8 Discussion

DA0-001 Exam Topic 8 Question 76 Discussion:
Question #: 76
Topic #: 8

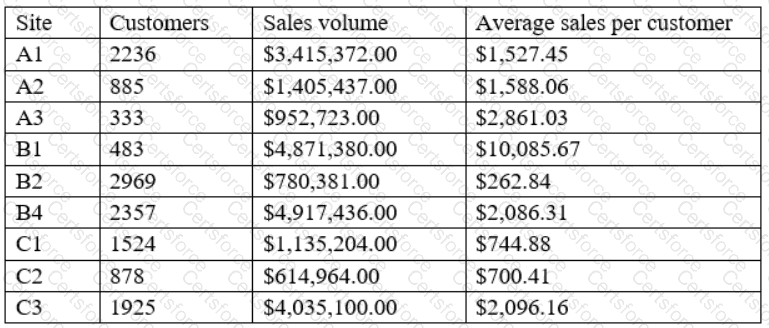
A data analyst is designing a dashboard that will provide a story of sales and determine which site is providing the highest sales volume per customer. The analyst must choose an appropriate chart to include in the dashboard. The following data is available:

DA0-001 Question 76

Which of the following types of charts should be considered?


A.

Include a line chart using the site and average sales per customer.


B.

Include a pie chart using the site and sales to average sales per customer.


C.

Include a scatter chart using sales volume and average sales per customer.


D.

Include a column chart using the site and sales to average sales per customer.


Get Premium DA0-001 Questions

Contribute your Thoughts:


Chosen Answer:
This is a voting comment (?). It is better to Upvote an existing comment if you don't have anything to add.