The following chart was created by a team.
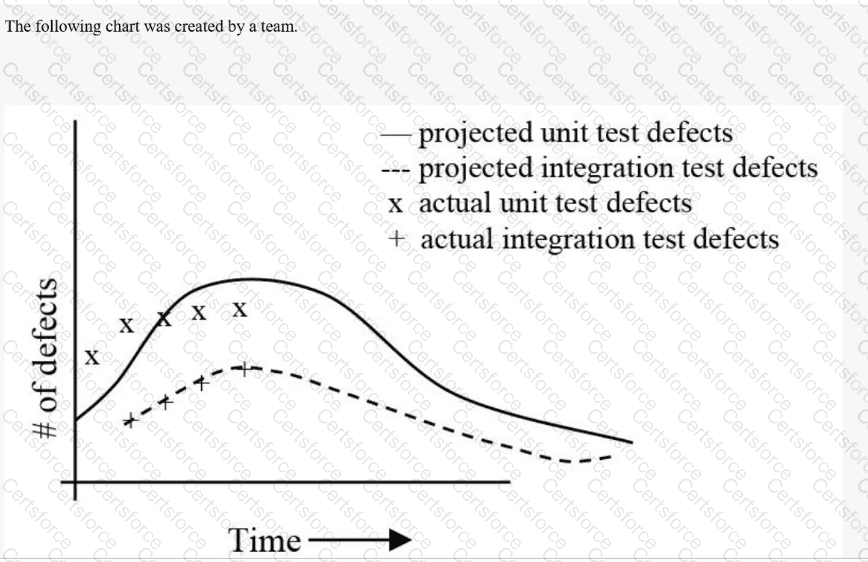
The chart shows number of defects over time, including projected unit test defects, projected integration test defects, actual unit test defects, and actual integration test defects. Which of the following conclusions can be drawn from this chart?
Submit