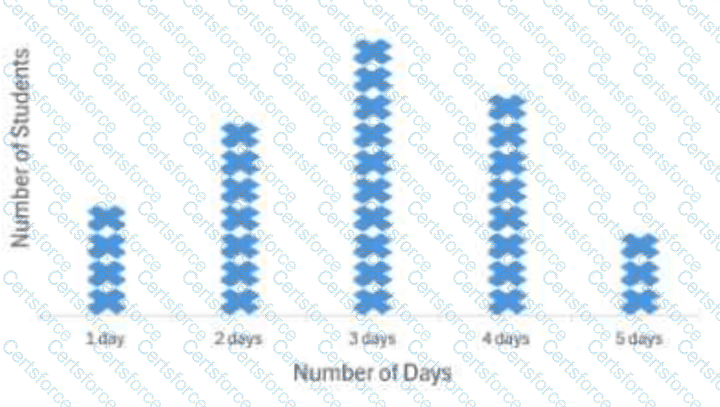
The dot plot shows a distribution centered near 3 days, with substantial frequencies at 2, 3, and 4 days and smaller frequencies at the extremes of 1 and 5 days. This shape is reasonably balanced around the center. When a distribution is approximately symmetric, the mean and median tend to be close because the lower and higher values balance each other. The median identifies the middle observation after the data are ordered, and the mean represents the balance point of the distribution. Since the tallest stack is near 3 days and the surrounding stacks on 2 and 4 days are comparable, the center of the data is approximately 3 days by both measures. There is no strong skew to pull the mean far above or below the median. Therefore, the best statement is that the mean is almost the same as the median. Options B and C would require clear skew or extreme imbalance, which the dot plot does not show. References/topics from the Study Guide: dot plots, mean, median, distribution shape, symmetry.
============
Contribute your Thoughts:
Chosen Answer:
This is a voting comment (?). You can switch to a simple comment. It is better to Upvote an existing comment if you don't have anything to add.
Submit