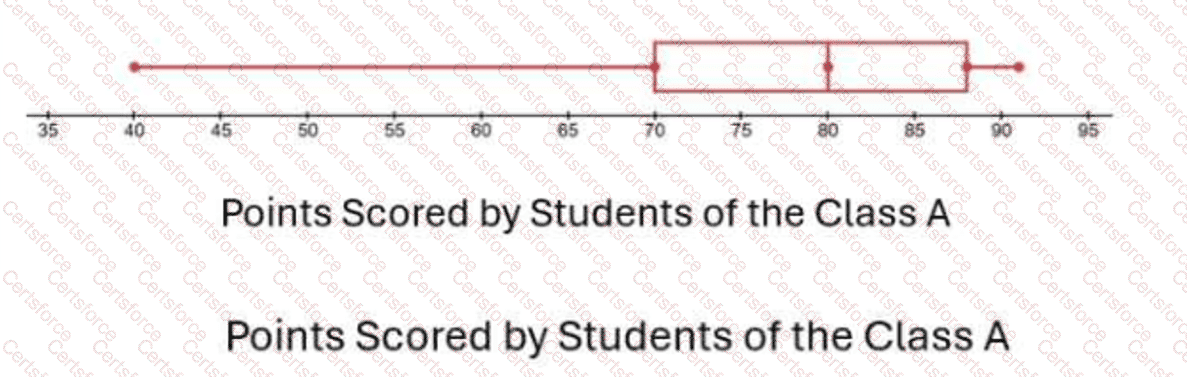
A box plot displays the five-number summary of a quantitative data set: minimum, first quartile, median, third quartile, and maximum. The median is represented by the vertical line inside the box. In the given box plot, that internal vertical line is positioned at 80 on the score axis. Therefore, the median test score for Class A is 80 points. The value 70 corresponds to the left edge of the box, which represents the first quartile, not the median. The value near 88 represents the right edge of the box, which is the third quartile. The whiskers extend to the approximate minimum and maximum scores, but those values do not determine the median. The median divides the ordered data into two equal halves, meaning about 50% of the students scored at or below 80 and about 50% scored at or above 80. References/topics from the Study Guide: box plots, five-number summary, median, quartiles.
============
Contribute your Thoughts:
Chosen Answer:
This is a voting comment (?). You can switch to a simple comment. It is better to Upvote an existing comment if you don't have anything to add.
Submit