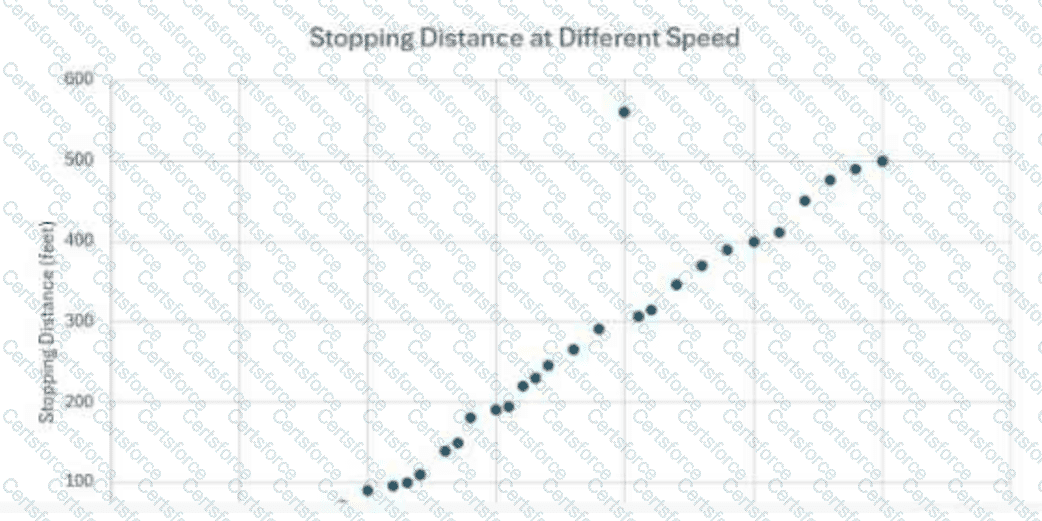
A road safety research group wants to enhance road safety by analyzing the stopping distance of a car at different speeds. The group has recorded their data in the following scatterplot.
What is true about the outlier in the scatterplot?
A.
The stopping distance of a car traveling at 10 mph is 20 feet.
B.
The stopping distance of a car traveling at 60 mph is 500 feet.
C.
The stopping distance of a car traveling at 30 mph is 190 feet.
D.
The stopping distance of a car traveling at 40 mph is 560 feet.
An outlier is a data point that does not follow the general pattern of the remaining data. In this scatterplot, most points show a clear increasing relationship: as speed increases, stopping distance also increases. The main cluster follows a smooth upward trend, with stopping distances gradually rising as speed increases. One point, however, is far above the rest of the pattern. That point is located at approximately 40 mph and 560 feet, making it unusually high compared with the expected stopping distance at that speed. This is why option D correctly identifies the outlier. Option A describes a low-speed point that fits the lower end of the trend. Option B describes a high-speed point near the upper end of the general pattern, not an unusual deviation. Option C describes a point around 30 mph and 190 feet, which lies within the main cluster of observations. The outlier is not merely an extreme x-value or y-value; it is unusual relative to the trend. References/topics from the Study Guide: scatterplots, outliers, bivariate data, association patterns.
Contribute your Thoughts:
Chosen Answer:
This is a voting comment (?). You can switch to a simple comment. It is better to Upvote an existing comment if you don't have anything to add.
Submit