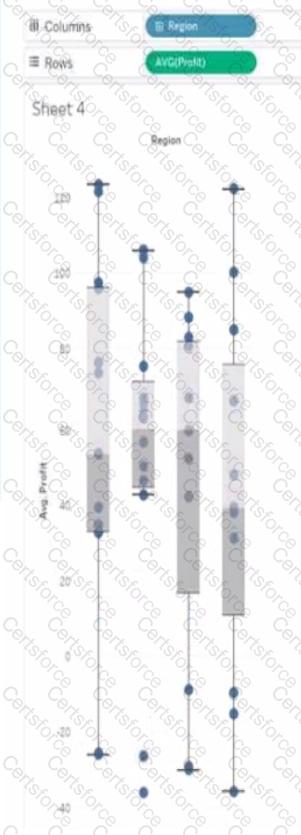
The box plot visualization displays the distribution of average profits by region. The distribution of profits is represented by the range of the box (interquartile range) and the whiskers (which often represent the total range excluding outliers). From the image provided, the South region has the smallest visible range within its box and the shortest whiskers, indicating the smallest distribution of average profits among the choices provided.
Contribute your Thoughts:
Chosen Answer:
This is a voting comment (?). You can switch to a simple comment. It is better to Upvote an existing comment if you don't have anything to add.
Submit