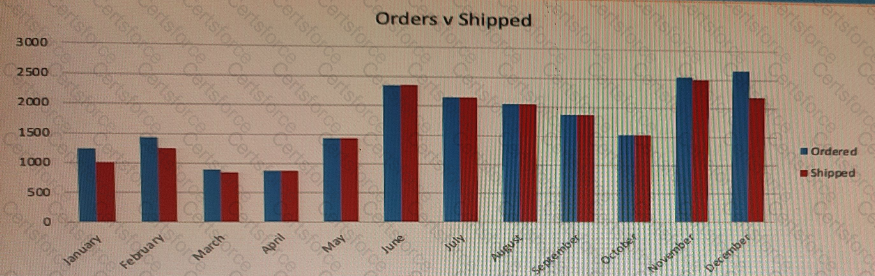
Refer to the exhibit
A data architect is working on an app that contains orders, invoices, and shipping data. There are three different date fields within the data:
* OrderDate
* InvoiceDate
* ShippingDate
The business analyst needs to replicate the chart above to show Order and Shipping amounts on the same Month axis.
What should the data architect do?
Submit