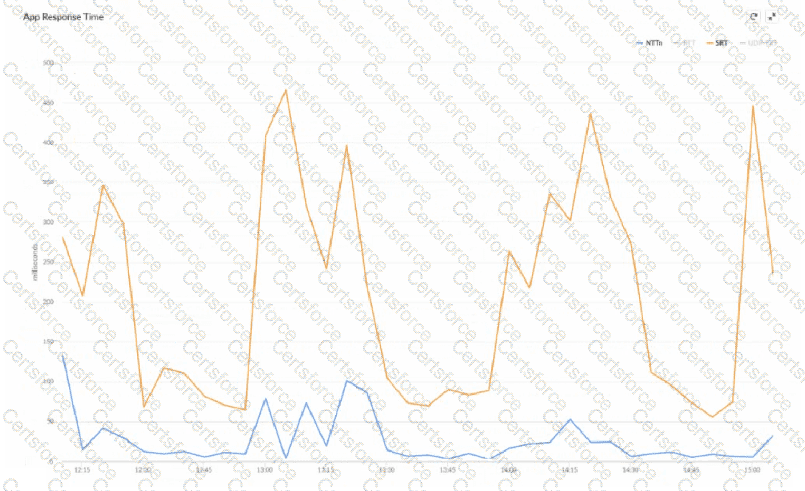
In Prisma SD-WAN, application performance is monitored through distinct metrics that separate network health from application health. The provided graph displays Network Transfer Time (NTT) in blue and Server Response Time (SRT) in orange. NTT measures the round-trip time of packets traversing the WAN fabric, while SRT measures the time elapsed from when the server receives a request to when it sends the first response packet.
Analysis of the telemetry data shows that the NTT (blue line) remains consistently low and stable, generally staying below 100 milliseconds throughout the capture period. This indicates that the SD-WAN path and underlying network circuits are not the source of the latency. Conversely, the SRT (orange line) exhibits significant and erratic spikes, reaching as high as 450 to 475 milliseconds. These spikes occur while the network latency (NTT) remains flat.
Because the latency increases are isolated to the SRT metric, the root cause is confirmed to be on the Application Server side. This pattern typically suggests that the server is struggling with resource exhaustion, high CPU utilization, or database query delays during peak processing times. For a real-time application, these SRT spikes translate directly to jitter and "lag" for the end-user. By distinguishing between these two metrics, Prisma SD-WAN allows network administrators to prove that the network is performing within SLA and shift the troubleshooting focus to the application or server management teams, significantly reducing mean time to innocence (MTTI).
Contribute your Thoughts:
Chosen Answer:
This is a voting comment (?). You can switch to a simple comment. It is better to Upvote an existing comment if you don't have anything to add.
Submit