Twenty daily systolic blood pressure measurements are shown in the graph. The red line indicates when a patient stopped taking their blood pressure medication.
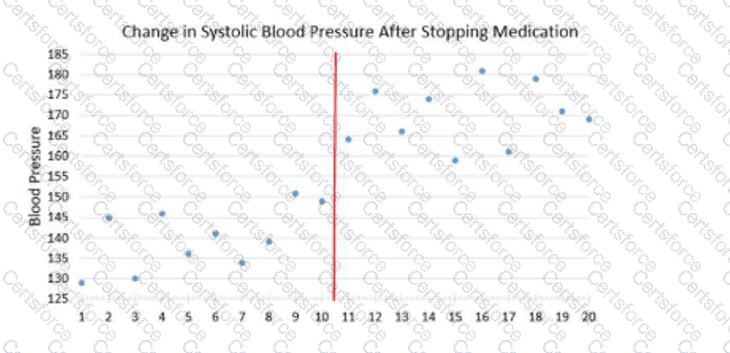
Estimate the patient’s average increase in blood pressure from the first set of 10 measurements to the second set of 10 measurements.
Submit