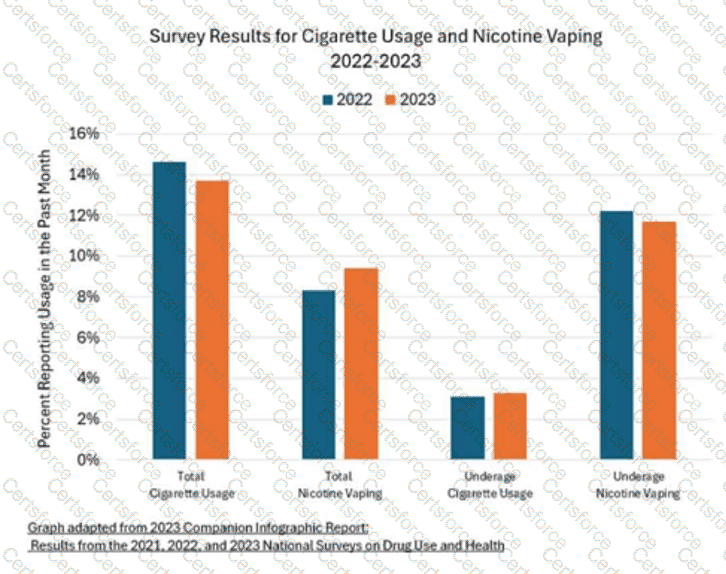
This question tests the ability to analyze and compare data presented in a bar graph. The graph shows both cigarette usage and nicotine vaping for total populations and underage populations in two different years. When focusing on the underage population, the bars for nicotine vaping are clearly higher than those for cigarette usage in both years shown. This indicates that vaping is more prevalent than cigarette smoking among underage individuals. The graph does not show an increase in total cigarette usage, eliminating option B. While vaping is high overall, the clearest and most directly supported conclusion is specific to the underage population. The NEX Science exam frequently includes questions requiring students to identify the most accurate conclusion supported by data rather than making assumptions beyond what is shown. Therefore, option A is the best answer.
======
Contribute your Thoughts:
Chosen Answer:
This is a voting comment (?). You can switch to a simple comment. It is better to Upvote an existing comment if you don't have anything to add.
Submit