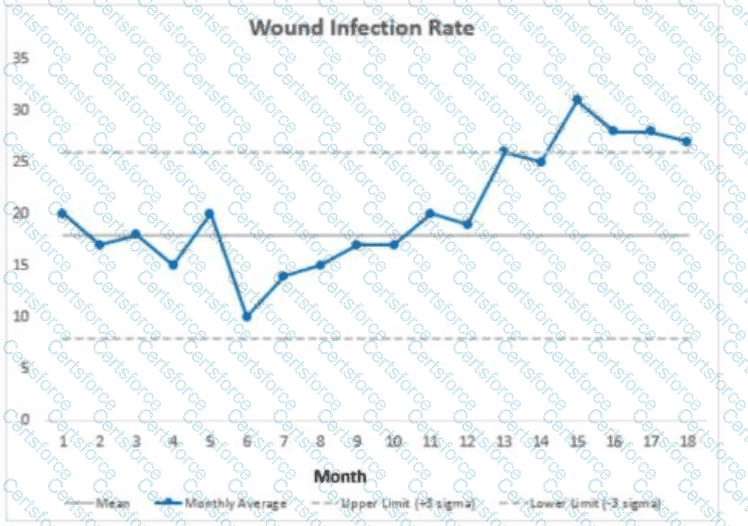
The control chart illustrates that the wound infection rate is trending upward with several points at or above the upper control limit, indicating special cause variation. This means the system is out of control, signaling that the variation is not due to random chance (common causes) but due to assignable causes which must be identified and addressed (The Joint Commission, 2024; Institute for Healthcare Improvement, 2023).
Option A is incorrect because chance events would produce random variation within control limits, but here data points exceed the upper limit.
Option B is incorrect as an out-of-control process should not continue without investigation.
Option C describes common cause variation which would appear as stable variation within control limits.
Option D correctly indicates that the infection rate is out of control, requiring evaluation and intervention to identify root causes and reduce infections.
[References:, The Joint Commission, Comprehensive Accreditation Manual for Hospitals (CAMH), 2024 Edition, Institute for Healthcare Improvement (IHI), Using Control Charts to Improve Quality, 2023, National Association for Healthcare Quality (NAHQ), CPHQ Study Guide, 2024, , , , , ]
Submit