
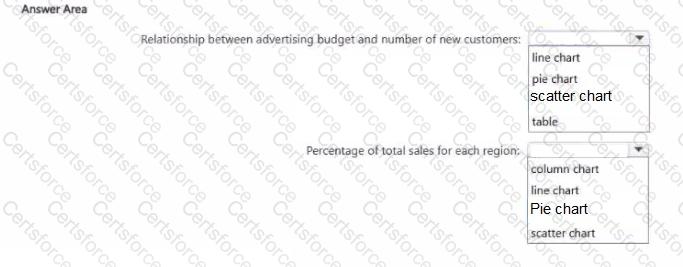
From Power Bi Desktop, you are creating a sales performance report. You need to create visualizations that meet the following requirements:
• Display the relationship between the advertising budget and the number of new customers.
• Show the percentage of total sales for each region.
Which type of visualization should you use for each requirement? lo answer, select the appropriate options in the answer area.
NOTE: Each correct selection is worth one point.

 C:\Users\Waqas Shahid\Desktop\Mudassir\Untitled.jpg

Submit