Microsoft AI Transformation Leader AB-731 Question # 16 Topic 2 Discussion
AB-731 Exam Topic 2 Question 16 Discussion:
Question #: 16
Topic #: 2
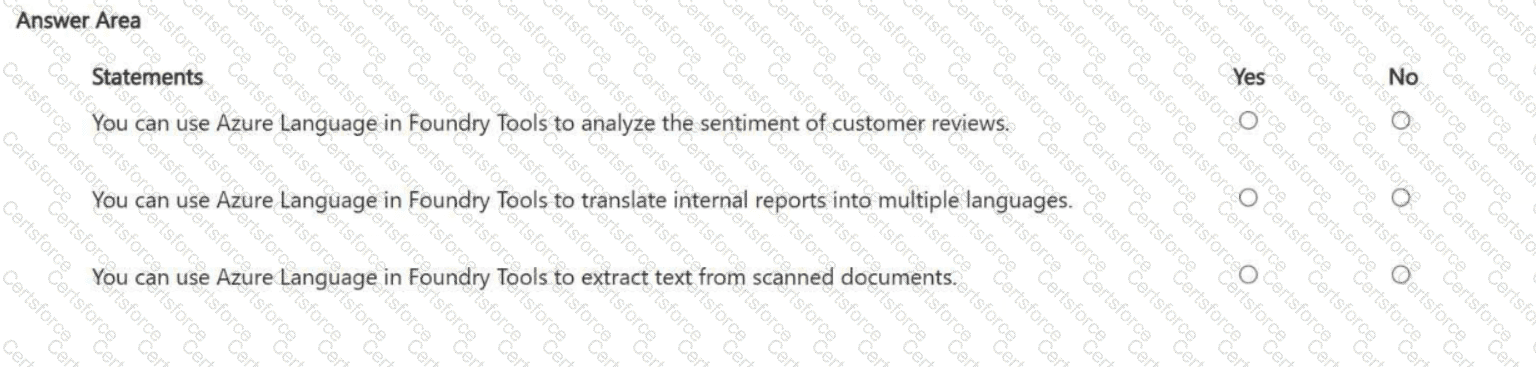
HOTSPOT - For each of the following statements, select Yes if the statement is true. Otherwise, select No . NOTE: Each correct selection is worth one point.
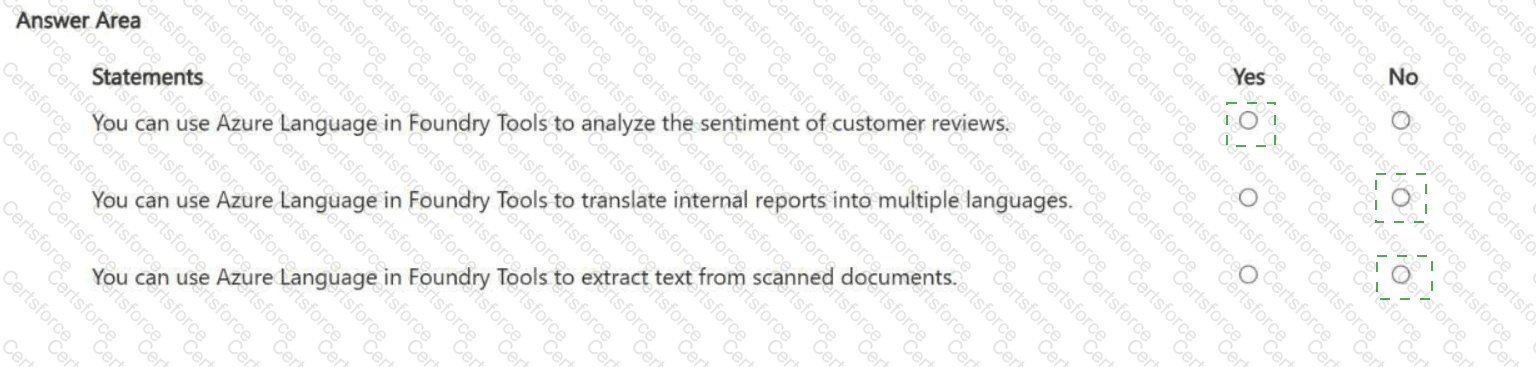
You can use Azure Language in Foundry Tools to analyze the sentiment of customer reviews. Answer: Yes
You can use Azure Language in Foundry Tools to translate internal reports into multiple languages. Answer: No
You can use Azure Language in Foundry Tools to extract text from scanned documents. Answer: No
Azure Language is designed for natural language processing (NLP) over text that is already machine-readable. That includes capabilities like sentiment analysis , key phrase extraction, entity recognition, summarization, and classification. Therefore, statement 1 is Yes : sentiment analysis of customer reviews is a standard NLP workload where the service scores text as positive/negative/neutral (and often provides confidence scores), helping organizations quantify customer satisfaction and detect recurring issues.
Statement 2 is No because translation is typically handled by a dedicated translation capability (commonly delivered as a separate translator service) rather than the core “Language” NLP features. While translation is an AI language workload, it’s not what the Azure Language service is primarily used for in this context; the expected Microsoft service choice for multi-language translation is the translator capability, not Azure Language.
Statement 3 is No because extracting text from scanned documents is OCR (optical character recognition), which is a computer vision/document processing function. OCR is delivered through Azure Vision and/or Azure Document Intelligence , which can read printed/handwritten text from images and PDFs and return structured output. Azure Language can analyze extracted text after OCR, but it does not perform the image-to-text extraction step itself.
Contribute your Thoughts:
Chosen Answer:
This is a voting comment (?). You can switch to a simple comment. It is better to Upvote an existing comment if you don't have anything to add.
Submit