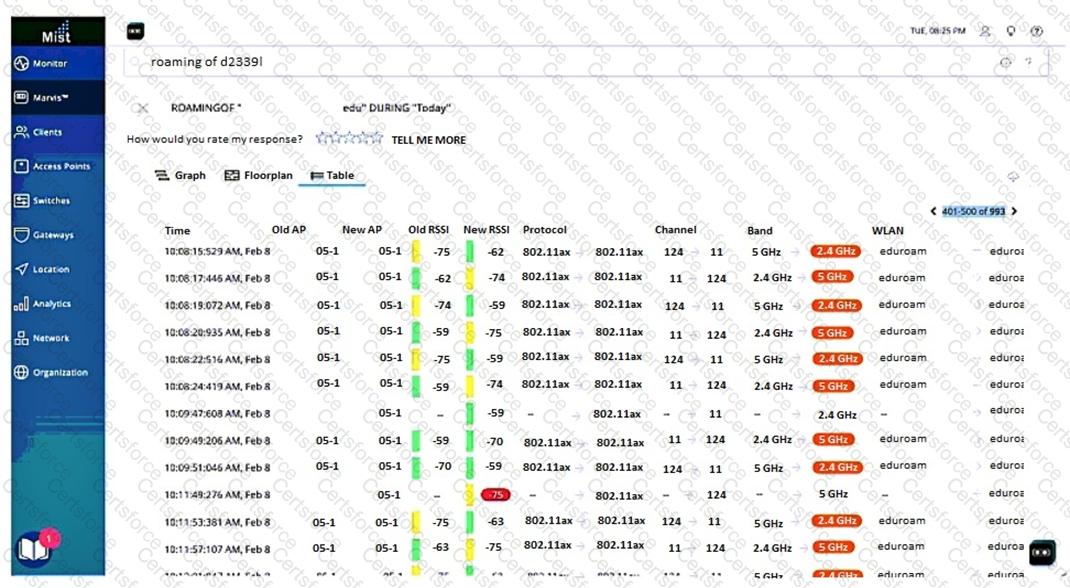
The exhibit shows a graph of the client’s roaming history over time. The x-axis represents the time and the y-axis represents the access point ID. Each dot on the graph indicates a roam event where the client switched from one access point to another.
The graph shows that the client roamed between different access points multiple times within a short period of time. This indicates that the client was experiencing frequent roams between different access points, which could affect its network performance and user experience.
Contribute your Thoughts:
Chosen Answer:
This is a voting comment (?). You can switch to a simple comment. It is better to Upvote an existing comment if you don't have anything to add.
Submit