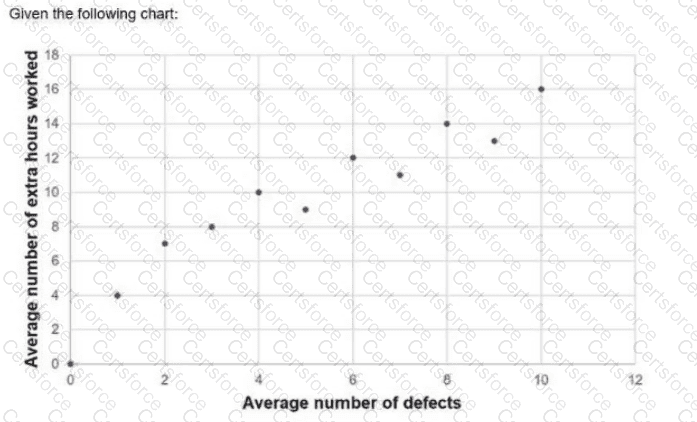
The results are best described as a positive correlation: as extra hours worked increase, the number of defects also increases. A positive correlation means the variables move in the same direction (higher X is associated with higher Y). This is consistent with the common quality-management interpretation that sustained overtime can correlate with higher error rates due to fatigue, reduced review quality, and rushed work—an important insight for a PM balancing schedule pressure with quality outcomes.
Within Project+ quality and performance monitoring concepts, interpreting basic analytical outputs (such as charts/diagrams that show relationships) supports better decisions about staffing approaches, sustainable pacing, and corrective actions (e.g., limiting overtime, increasing peer review, adding automated tests, or re-planning). The distractors represent other possible patterns: “no correlation” would show scattered results without a trend; “negative correlation” would show defects decreasing as hours rise (unlikely for overtime/fatigue scenarios); and “non-linear” would require evidence of a curved pattern rather than a straight trend. Based on the stated results interpretation for this scenario, the correct description is positive correlation.
Contribute your Thoughts:
Chosen Answer:
This is a voting comment (?). You can switch to a simple comment. It is better to Upvote an existing comment if you don't have anything to add.


Submit