Data cleansing is a critical process in data analytics to ensure the accuracy and quality of data. The reasons to undertake data cleansing include:
Missing Data (B): Missing data can lead to incomplete analysis and biased results. It is essential to identify and address gaps in the dataset to maintain the integrity of the analysis1.
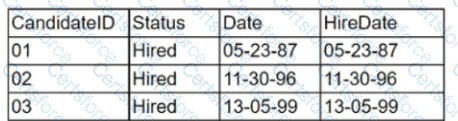
Invalid Data (D): Invalid data includes entries that are out of range, improperly formatted, or illogical (e.g., a negative age). Such data can corrupt analysis and lead to incorrect conclusions1.
Other options, such as non-parametric data (A), are not inherently errors but refer to a type of data that doesn’t assume a normal distribution. Duplicate data © and redundant data (E) could also be reasons for data cleansing, but they are not listed as options to select from in the provided image details. Normalized data (F) refers to data that has been processed to fit into a certain range or format and is typically not a reason for data cleansing.
[References:, Understanding the importance of data quality and the impacts of missing and invalid data on research outcomes1., Best practices in data cleansing2., Data cleansing is required for various reasons, two of which are missing data (B) and invalid data (D). From the table provided, we can infer the necessity of cleansing in the context of ensuring data integrity and consistency. Missing data refers to the absence of data where it is expected, which can hinder analysis due to incomplete information. Invalid data refers to data that is incorrect, out of range, or in an inappropriate format, which can lead to inaccuracies in any analysis or report. Both these issues can significantly affect the outcomes of any data-related operations and thus need to be rectified through the data cleansing process., , , ]
Submit