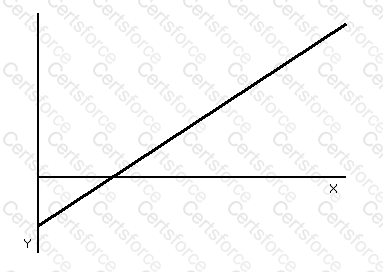
Refer to the exhibit.
Vertical axis = £; horizontal axis = level of activity
This graph is known as a:
Conventional break-even graph
Contribution break-even graph
Profit volume graph
Variable cost graph
Submit