CIMA Fundamentals of Business Economics BA1 Question # 125 Topic 13 Discussion

CIMA Fundamentals of Business Economics BA1 Question # 125 Topic 13 Discussion

BA1 Exam Topic 13 Question 125 Discussion:
Question #: 125
Topic #: 13

Mrjohnson, the managing director of Brilliant Buys, wants to plot the cumulative sales figures for each store nationwide over the course of a year on a graph. The sales by store are shown below:

BA1 Question 125

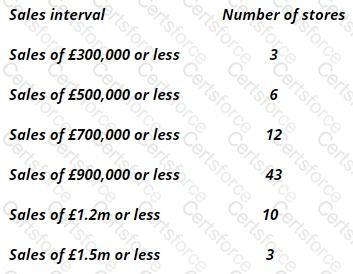
If these figures were plotted on an ogive, what would the line of cumulative frequency look like?


A.

Rises until it reaches sales of £900,000 or less on the x axis, then declines


B.

Rises until it reaches halfway between sales of £700,000 and £900,000 on the x axis, then declines


C.

Rises until it reaches 43 stores on they axis, then declines


D.

Rises until it reaches 43 stores on the x axis, then declines


Get Premium BA1 Questions

Contribute your Thoughts:


Chosen Answer:
This is a voting comment (?). It is better to Upvote an existing comment if you don't have anything to add.