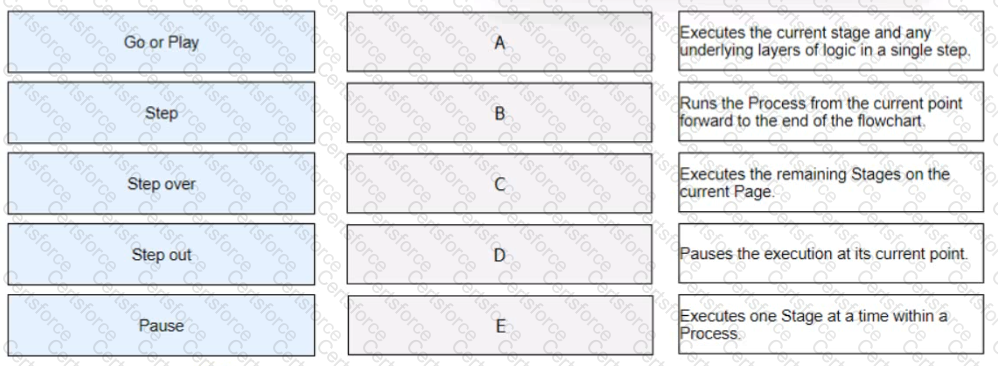
Drag and drop the Blue Prism debug tool names on the left, onto the placement boxes (A- E) so that the dropped tool name corresponds with the debug tool description beside it:
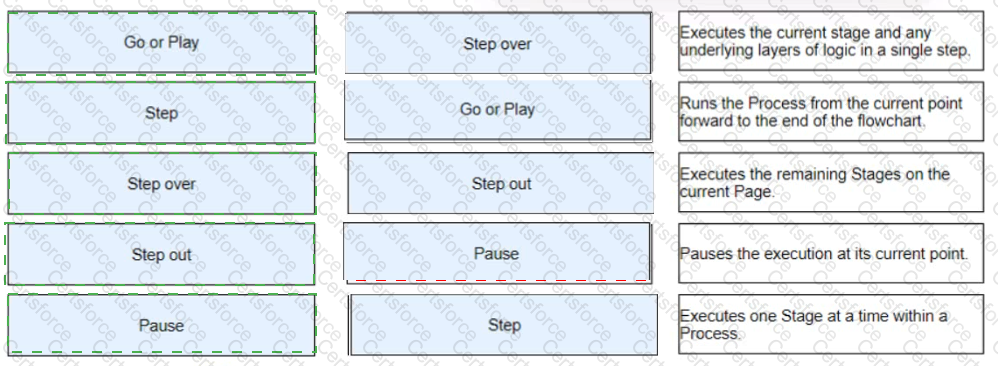
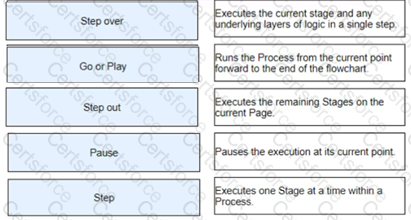
These are the correct matches between the debug tool names and their descriptions. They allow the user to control and observe the execution of a process or object in studio. The other options are either incorrect or not available. References: https://bpdocs.blueprism.com/bp-6-10/en-us/helpDebug.htm?TocPath=Interface%7CStudio%7CProcess%20studio%7C_____7 (page 1)
Contribute your Thoughts:
Chosen Answer:
This is a voting comment (?). You can switch to a simple comment. It is better to Upvote an existing comment if you don't have anything to add.
Submit